

In this post, I will not cover the benefits of using data for Public Relations, nor will I go into why as an SEO you may use classic PR tactics to get more publicity in the form of mentions and links; enough has been written on the topic. Instead, I will dive into a very specific tactic that has been successful for my team again and again over the years–offering your data’s local angle, to local journalists. This data-driven tactic isn’t limited to companies focused on data, in fact, it can benefit any medium-sized website, or larger, in getting more mentions and links.
While everyone wants to be mentioned and covered by top-tier national and global publications, there is an additional layer of publications, the local ones, that all have one thing in common — Publishing stories for people who live or care about a specific geographical area. A local publication could be focusing on a specific city, state or region, or even a small country. While the writers and editors of top-tier publications are being pitched national and international stories every day, local publications are (still) getting much less attention. This fact doesn’t mean they are writing less often.
Just like their larger opponents, they also want to publish compelling stories on a regular basis. In this case, stories that are relevant specifically to their local readers.
If your website is serving users from all parts of the country, or even multiple countries, you probably have access to local user data. Data you may have been ignoring because you didn’t even think it had much use. As a website that, for example, sells books, reviews travel destinations, or even offers insurance tips, you may have been under the impression that your local data for different cities isn’t very relevant. However, the different trends in people’s interest between geographical areas could be of very high interest to the right journalists or bloggers.
By turning this data into a story that these journalists and bloggers would want to cover, you’ll increase your presence on their sites. And don’t worry about not being credited for your data – any credible publication needs to reference a source when pointing to stats from a third party, otherwise, they will have to take responsibility for the accuracy of that data, and that’s not something any credible website would do.
There are Three Simple Ways to Look at Your Local User Data:
- Focusing on the data of a specific area.
- Comparing one local area with another, such as New York vs. Los Angeles.
- Comparing a specific area with the country’s average. For example, comparing Boston’s data with the US average.
For the last two, the same concepts can also work on a global scale, looking at the data of one country vs. another, or a single country vs. the global average.
While this tactic might remind you of another popular PR trend from recent years, i.e., “offering maps”, here we want to focus specifically on the local websites, and their unique local angles. Often, you will see that you have interesting insights for more than just one area and that you are able to pitch the same story with a few individual local angles, to different local websites.
How to Access Local User Data in Google Analytics
Finding your local user data is in fact much easier than you may think. With every hit Google Analytics counts for your website’s activity, it also attributes quite a few different dimensions. These include the traffic source, browser, device type, and many more including a few geo dimensions, the main ones including City, Region (state or area), and Country.
To get your local data you can build a custom report, add a secondary dimension to most standard reports and choose any of the geo dimensions, or simply use Segments–one of my favorite features GA offers to all users. Segments allow you to look at your entire GA view in any narrow view, filtered by any dimension or other rules you apply. This means that with Segments you can look at all of the data your GA has collected from the eyes of that specific filtered audience. When applying two Segments at the same time, comparing the two areas becomes very easy.
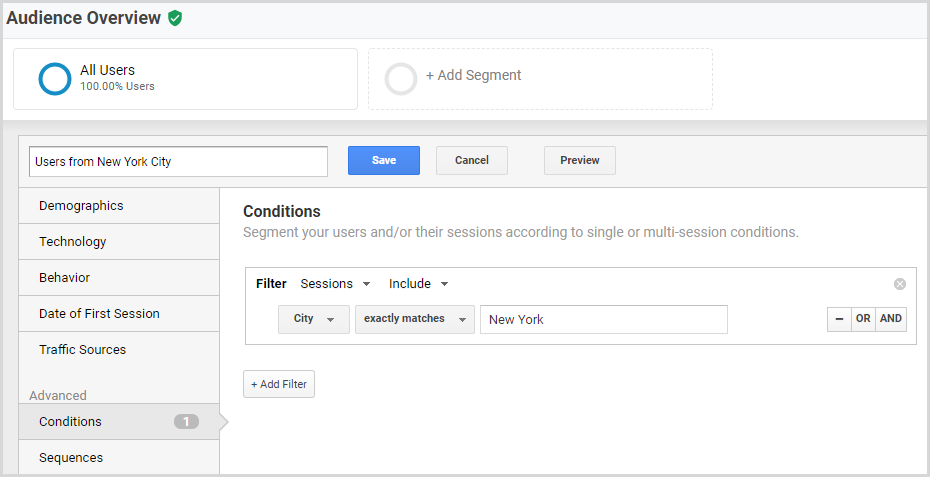
Building Your First City Segment?
Go to any of your GA reports, click on “+ Add Segment”, “+ NEW SEGMENT”, Name the new Segment, Choose “Conditions”, Search for “City” in the dimensions drop down (Usually under “Ad Content”), switch “contains” to “exactly matches”, add a City such as ‘New York’ and Save.
You can then add an additional Segment, for example, ‘All Users’, for your first comparison.
Two Examples to Illustrate the Concept:
- Your website reviews travel destinations in English and is focused on a US audience.
You are considering pitching a journalist from a local publication in Colorado who you have noticed often covers Travel. As a travel site, you know which travel destinations are the most popular ones, domestically and internationally; you know where people prefer going in the summer compared to the winter; you know which Ski resorts are the most popular ones; and you even know which time of year people usually begin booking cruises.
By taking the local data you have for Colorado specifically, and comparing it with any other state or with the country’s average, you may have a story for this local publication. You probably won’t surprise him with local Ski Resorts, but you may surprise him with the preference of locals when it comes to traveling to New York City vs. San Francisco. You may also surprise him with Coloradans’ favorite summer vacation destinations; do Coloradans prefer vacationing in Florida or in the Bahamas? Or maybe Coloradans simply have a very different preference when it comes to choosing a European vacation.
- Your website offers food recipes in multiple languages and it serves people from all around the world.
There is a local journalist from Australia who writes a lot about Aussies’ food preferences. Do you think you could provide him with stats on Australians compared to the rest of the world? Do Australians like pasta as much as Americans do? And what about allergies and food sensitivities? Can you estimate the percentage of people with gluten intolerance in Australia compared to Europe or the US with your own data on the most popular recipes?
And what about that one German food blogger from Berlin; can you tell him what’s different about the recipe searches on your site for Germans specifically? And the difference in taste preferences between Berlin, Munich, and Freiburg? Perhaps the difference in their favorite beers or desserts?
So How Do I Spot Something “Interesting” For a Local Angle?
Whether your website is about a specific hobby, covers education or tech, or if it is around banking services, health, news, shopping, or even weight loss for that matter, you should be able to find a local angle to one of your industry’s trends or known facts. To spot “interesting” local user data, you need to ask the right questions. Begin by looking for current popular trends around the topics you cover, since these will be of the highest interest for journalists to write about.
Continue to known facts that perhaps you are able to disprove or new facts you may reveal. If a known fact or stat about Americans is obvious from your data, see if this is the case in every state. It is very possible that there is an exception and that this trend is entirely opposite in a particular area.
For example, when the cryptocurrency market boomed in 2017 we were able to produce numerous stories based on our local user data. People from all over the world expressed interest as Bitcoin’s price began to surge. We wanted to know if there were any geographical areas that expressed significantly more interest than others. We compared both US states and countries throughout the world. One successful campaign included the state of Texas, where we found a correlation between very high interest and legalization. Texas was the first state to release an official statement on bitcoin and the first state where a Bitcoin-only real estate transaction took place. Another story revealed that the top 5 countries interested in Cryptocurrencies were all East European countries, and we linked this trend to cheap energy costs, making cryptocurrency mining affordable. In both cases, we calculated the percentage of users checking the relevant pages against the total pageviews for each area. We wrote a few separate stories for each of the findings and pitched both local sites and sites that covered the topic with some very good results and placements.
Another story came up entirely by coincidence when we were checking demographics for an advertiser. It made us look for the state with the highest ratio of female investors. Another one was finding the most popular Tech stock in every US state, and the correlation between the region’s political views.
Finding the ideal angle is often the main challenge, so once you have the trends, known facts, and the conclusions your data reveals, list the ideal stats you would want to find and expand the search by local areas for comparison, then continue to the next one.
Significant differences in demographics (Age, Gender) often attract a lot of media attention, but also simply look for what is most popular on your site. Review your Content, Site Searches, Features, or anything else your site offers, such as the items your users buy or any other special goals and custom metrics.
Of course, you can always see what else is out there, but only focus on what hasn’t been covered yet. Look for the areas that stand out; journalists usually prefer the more extreme stats, hopefully with a surprising element.
Once you have spotted your special data you have for a region, it is time to write your story around it and find the relevant journalists or bloggers who are most likely to cover it.
How to Choose Local Sites to Distribute Your Story?
Since there are so many local areas and publications, it only makes sense to start compiling your list of local websites after you have the data and story ready.
The first thing would be to make a list of the local websites that might be interested in your story. You will have to dig a little bit, but finding these sites is quite simple. Begin by going through the sites and lists found when searching for ‘%AREA% local newspapers/news/blogs’, so for example; ‘Colorado local newspapers’, ‘Seattle local news’, or ‘Florida local blogs’.
Continue by searching for relevant topics together with the area’s name on Google News, and try any of the tools you use to spot competitors. Once you have the first relevant website (for example ‘The Denver Post’), find its direct organic competitors. Most of them will be the local websites you’re looking to list.
With SEMRush, simply go to Domain Overview>Denverpost.com>Main Organic Competitors.
Once you have your full list of potential local websites, it’s time to prioritize them before pitching the first one. Here are a few possible things to consider for your prioritization:
- Data’s relevancy to the topics usually covered by each website
- Websites’ traffic volume
- Audience overlap with your website (relevancy)
- A journalist’s prior exposure on a specific site – for example, is he or she usually featured on the site’s homepage?
- How often the journalist writes
- How the journalist usually credits 3rd party websites
Distributing Your Story
After your list is prioritized, it’s time to break it into tiers. You will usually have the main 1 to 3 websites you want to offer your story to first, so you should decide on the time frames for each website to respond before moving on to the next one. Not all websites will respond, and that’s exactly why prioritizing the list and deciding how long you can wait for each is so important. If you believe that your story is extremely interesting, and that you’ve been able to spot a trend or reveal a fascinating fact for this local area, consider offering exclusivity to the first website (or a few websites) you pitch.
“Exclusivity” is a very strong enticement for news publications and often for blogs too. The fact that they have the potential of revealing something for the very first time, ahead of their competitors, can help you get much better exposure on their site. It has a better chance of being promoted to their homepage, and through their internal communication channels with their users; such as newsletters, social media, push notifications and more.
In the end you don’t just want your story to be published. You want as many people as possible to read it and get exposed to the story and your brand. Make sure you choose the most relevant websites, the most relevant journalists and that you give them enough time to respond.
The possibilities with local user data are almost endless, and I believe that any website can find interesting industry trends if they just dig deep enough. Remember that any nationwide perception can probably be refuted at least somewhere.
Have you tried creating stories based on local users data so far?
Any other tips of things you can do with data available in GA? Let us know in the comments below!